Last week I was on Environment Variables, talking about carbon footprints and sustainability in open source. Here are my extended show notes!
This is a links-heavy version of what we discussed, for people who want to follow references.
The recording
Get it here:
It’s also available on YouTube if you’d prefer to watch Chris and I talk.
The topic
We had a few things lined up but the overarching theme was the importance of considering the carbon footprint of software in open source projects. As Wagtail Product Lead at Torchbox, and President of the Django Software Foundation, I’ve spent a fair bit of time thinking about the footprints of Wagtail and Django, and considering how we can take ownership of reducing said footprint. Which isn’t easy, as we have little control over how people use our software!
A good illustration of this is the total carbon footprint of Wagtail sites mapped across regions of the world:
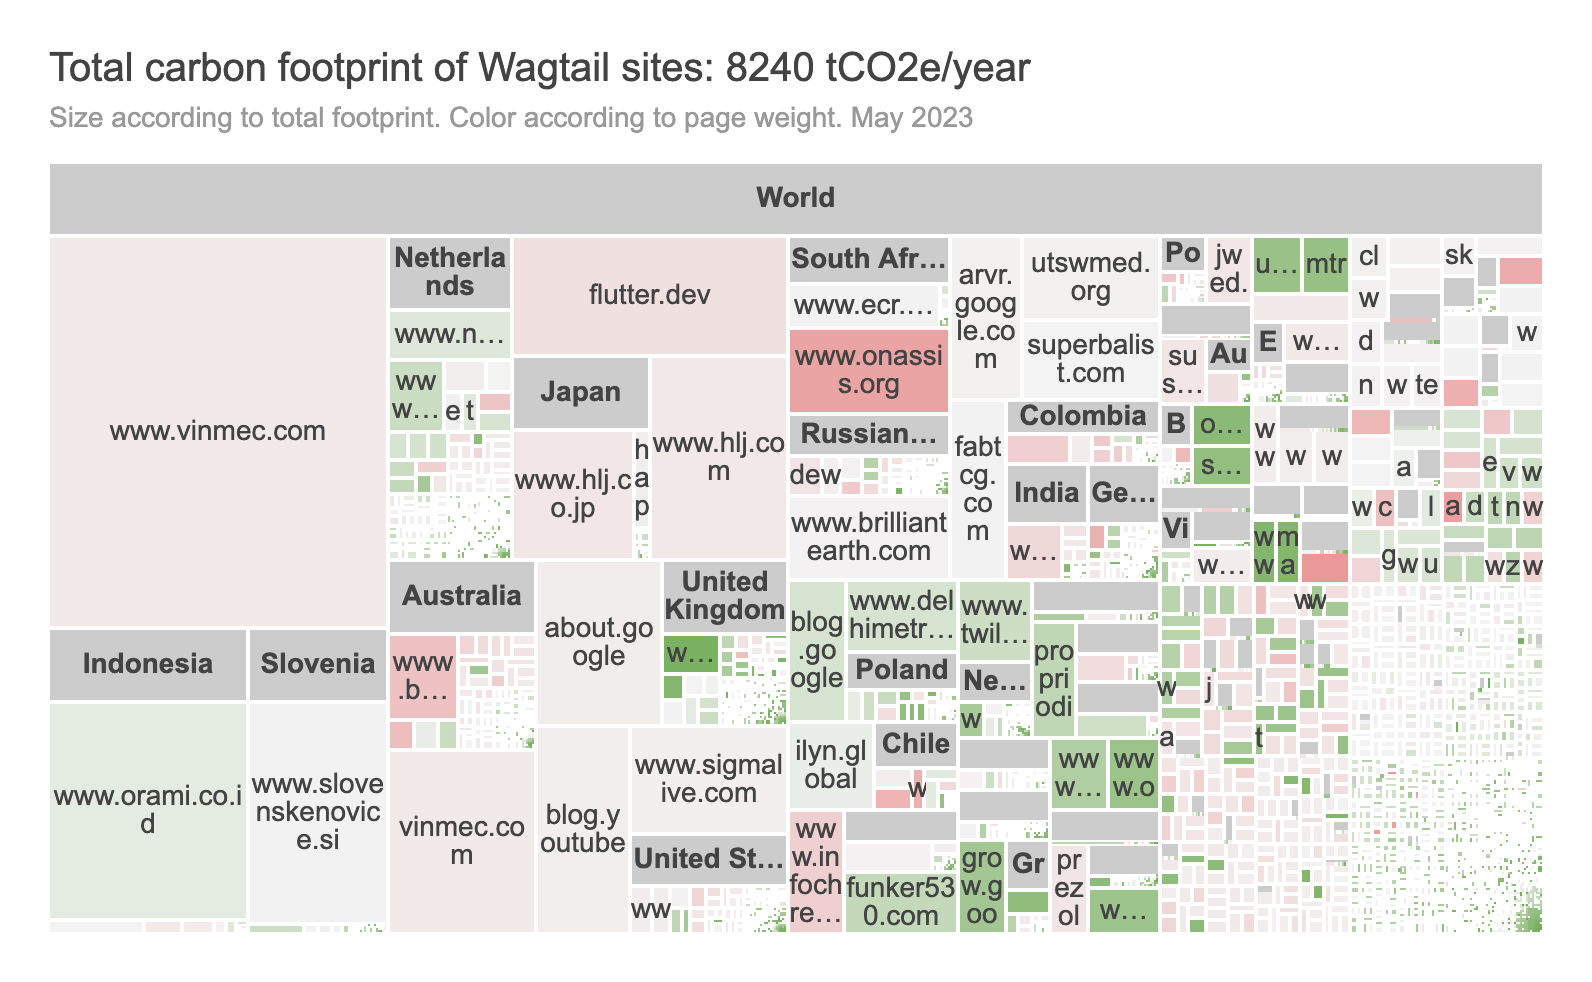
Most of those sites, I’ve never heard of. That’s just how our relationship with users tends to be in open source software.
Extended show notes
Why and how to measure digital carbon footprints
We started by discussing the necessity of measuring digital carbon footprints and my history getting up to speed on this topic.
- I looked into dark mode’s energy savings in 2022 (and went further just a few months ago).
- At Torchbox, we spent a lot of time on this for our 2022 impact report, reviewing the emissions of 50-100 websites we built or worked on.
- Recognizing the scale and complexity involved, we expanded this effort to estimate emissions across the entire Wagtail ecosystem, encompassing thousands of websites.
For Wagtail, we’re talking on the order of 10-20,000 websites, each with a footprint on the order of 0.5 to 1.5 tons of CO2 per year. So 5000 to 15000 tons of greenhouse gas emissions per year. For Django, best case scenario is about 20x that.
Choosing methodologies
For websites, here’s our four go-to methodologies at Torchbox, and their suitability for different types of initiatives:
| Initiative | SWD | Hosting infrastructure | GreenFrame | Display power consumption |
|---|---|---|---|---|
| Infrastructure reduction or relocation | Avoid | ✅ Recommended | Inapplicable | Inapplicable |
| Back-end / database / server code optimisations | Avoid | Consider case-by-case | ✅ Recommended | Inapplicable |
| Front-end code optimisations | ✅ Recommended | Inapplicable | Consider case-by-case | Inapplicable |
| Dark theme | Inapplicable | Inapplicable | Inapplicable | ✅ Recommended |
| Design / product changes | ✅ Recommended | Inapplicable | Consider case-by-case | Inapplicable |
| Carbon reduction KPIs | Consider case-by-case | Consider case-by-case | Consider case-by-case | Consider case-by-case |
This is from our 2022 work on methodologies to quantify site emissions, still very relevant in 2025: Announcing our Digital Emissions Methodologies
Wagtail’s footprint
Wagtail’s 2023 Estimating Wagtail websites’ emissions was our first attempt at this. We’ve since further refined our approach but haven’t shared the updated 2023 / 2024 / early 2025 numbers yet, because the numbers are changing due to a lot of factors that are hard to reason about:
- The main model we use has switched from Sustainable Web Design v3 to v4, which reports generally lower emissions 🔽.
- It’s based on sites’ page weight, which has gone up, which is bad 🔼.
- It’s also based on the Ember electricity grid carbon intensity data, which has generally gone down, which means sites might still use the same amount of energy but pollute less (which is good!) 🔽.
- But the number of sites has gone way up, so the total emissions are still increasing 🔼.
- And our estimations of Wagtail sites’ page views have gone down, which means lower emissions 🔽.
So this is pretty confusing! But hey if you want to explore,
- The Wagtail sites emissions dashboard spreadsheets have all the unreleased data.
- Sustainable Web Design emissions calculator as a spreadsheet covers the formulas we’re trying to use for SWDM v4.
- ranking-to-pageviews is my side project to extrapolate page views from website Chrome UX report rankings, which is the main data source for Wagtail sites’ page views.
Current goal is to release this data with a representation as Digital Carbon Ratings, but even that adds another layer of indirection, so we’ll see. It looks like that currently, for 2024 figures:
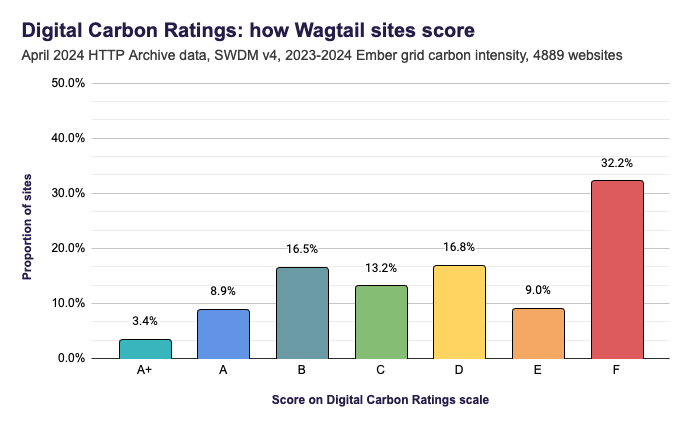
That’s a neat representation of overall performance of Wagtail sites, but even understanding that requires a lot of context. For example, the way the ratings are designed, the number of sites falling in each category isn’t meant to be proportional! More on that in a future post.
Anyway, the tentative number of sites for 2025 goes up from 4889 to 6431 sites in the dataset. With a footprint still on the order of 5000 - 10000 tons of CO2 per year.
Using other models
All of the above is with Sustainable Web Design. We’re also experimenting with other ways to estimate or even measure a site’s emissions:
- With GreenFrame and Green Metrics Tool, on a traditional site setup: bakerydemo-gold-benchmark
- Comparing different site setups (headless vs. static vs. traditional), with just GreenFrame: benchmark-wagtail-demo
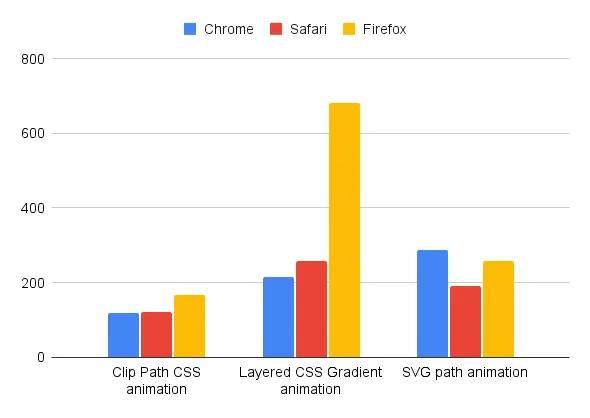
- With the Firefox profiler: How much power do web assets use?
Here’s a sample from that last article, showing the power consumption of different animation techniques in CSS and SVG according to this profiler:
Practical steps towards greener websites
On the podcast, we reflected on how Wagtail actively works on reducing websites’ footprint through initiatives like Google Summer of Code (GSoC). Over three years, our GSoC projects have tackled different sustainability improvements:
- Leaner images, lower footprint, at scale showcases adoption of modern image formats and responsive image techniques to significantly reduce image weights.
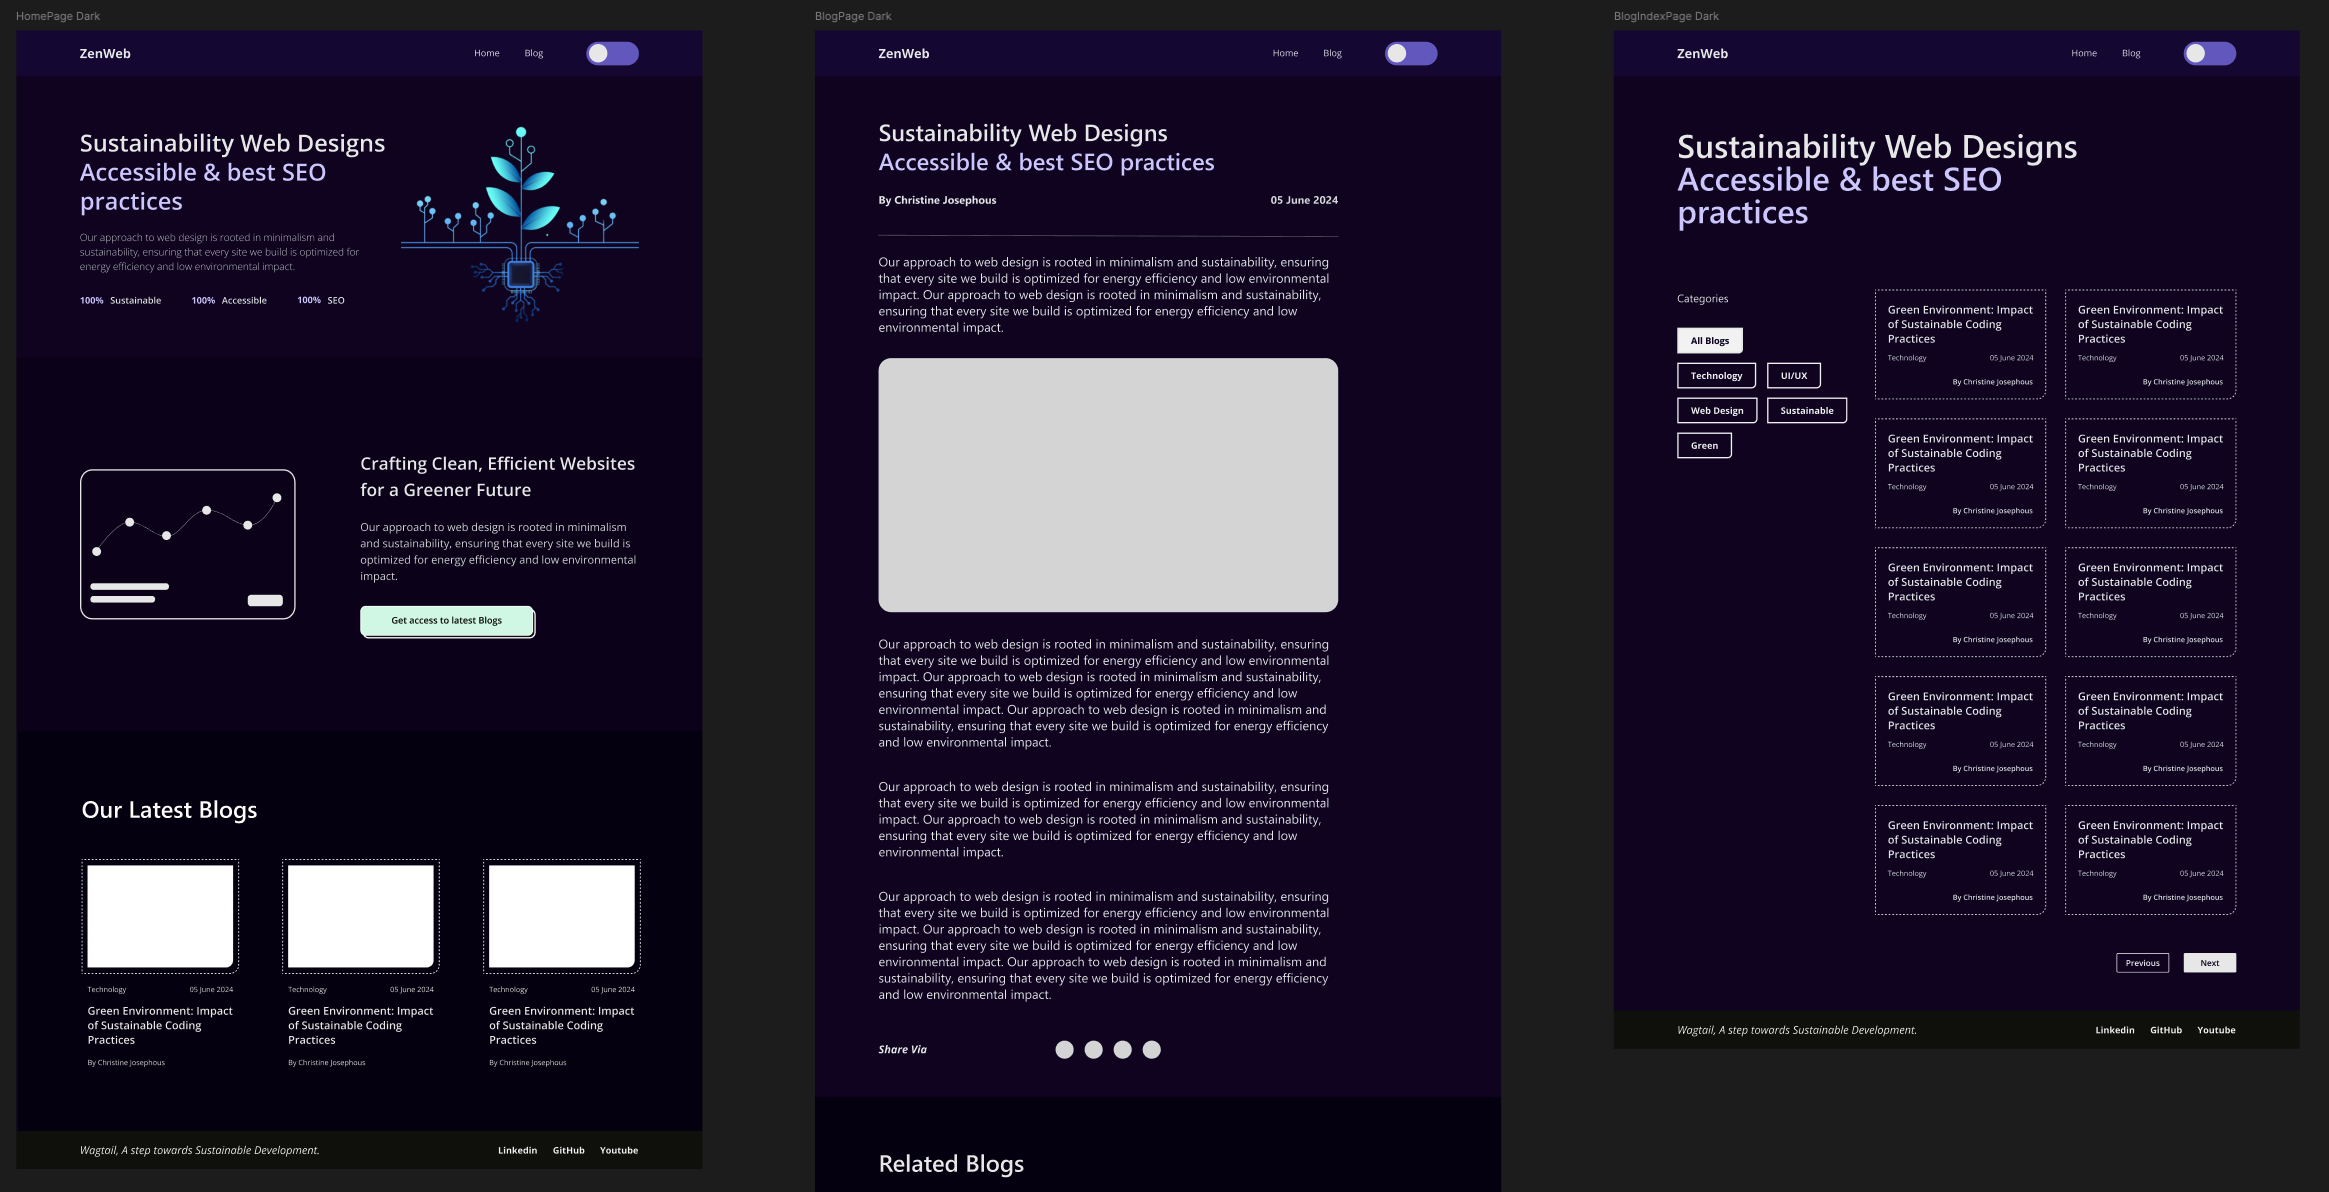
- The (still work in progress) low-carbon template is our attempt at reducing the footprint of newly-built sites. The designs are finalized and heavily optimized (see below), but the implementation still needs work.
- And in 2025, grid-aware websites present the opportunity to deliver sizeable reductions on existing sites.
Low-carbon designs by our GSoC contributor Nandini Arora:
There are lots of other steps that projects can take. See for example my assessment of the Web Sustainability Guidelines. The latest Web Sustainability Guidelines are an excellent resource to explore all the possible ways to improve digital sustainability.
Taking responsibility as an open-source community
Unlike corporate structures with reporting and accounting standards defined by frameworks like the GHG Protocol, we don’t have such clear definitions of how to track direct and indirect emissions in open source. My go-to is GHG Protocol Scope 3 Category 11: Use of Sold Products (PDF), which is optional to report on in most accounting frameworks, but definitely important in my opinion. However it fits much better to appliances, than open source libraries to build sites and apps with.
I’ve learned a lot from Mozilla’s pioneering work on including Firefox usage emissions in their reporting (2020: Release: Mozilla’s Greenhouse Gas emissions baseline, latest: Mozilla’s Emissions Data). This chart specifically:
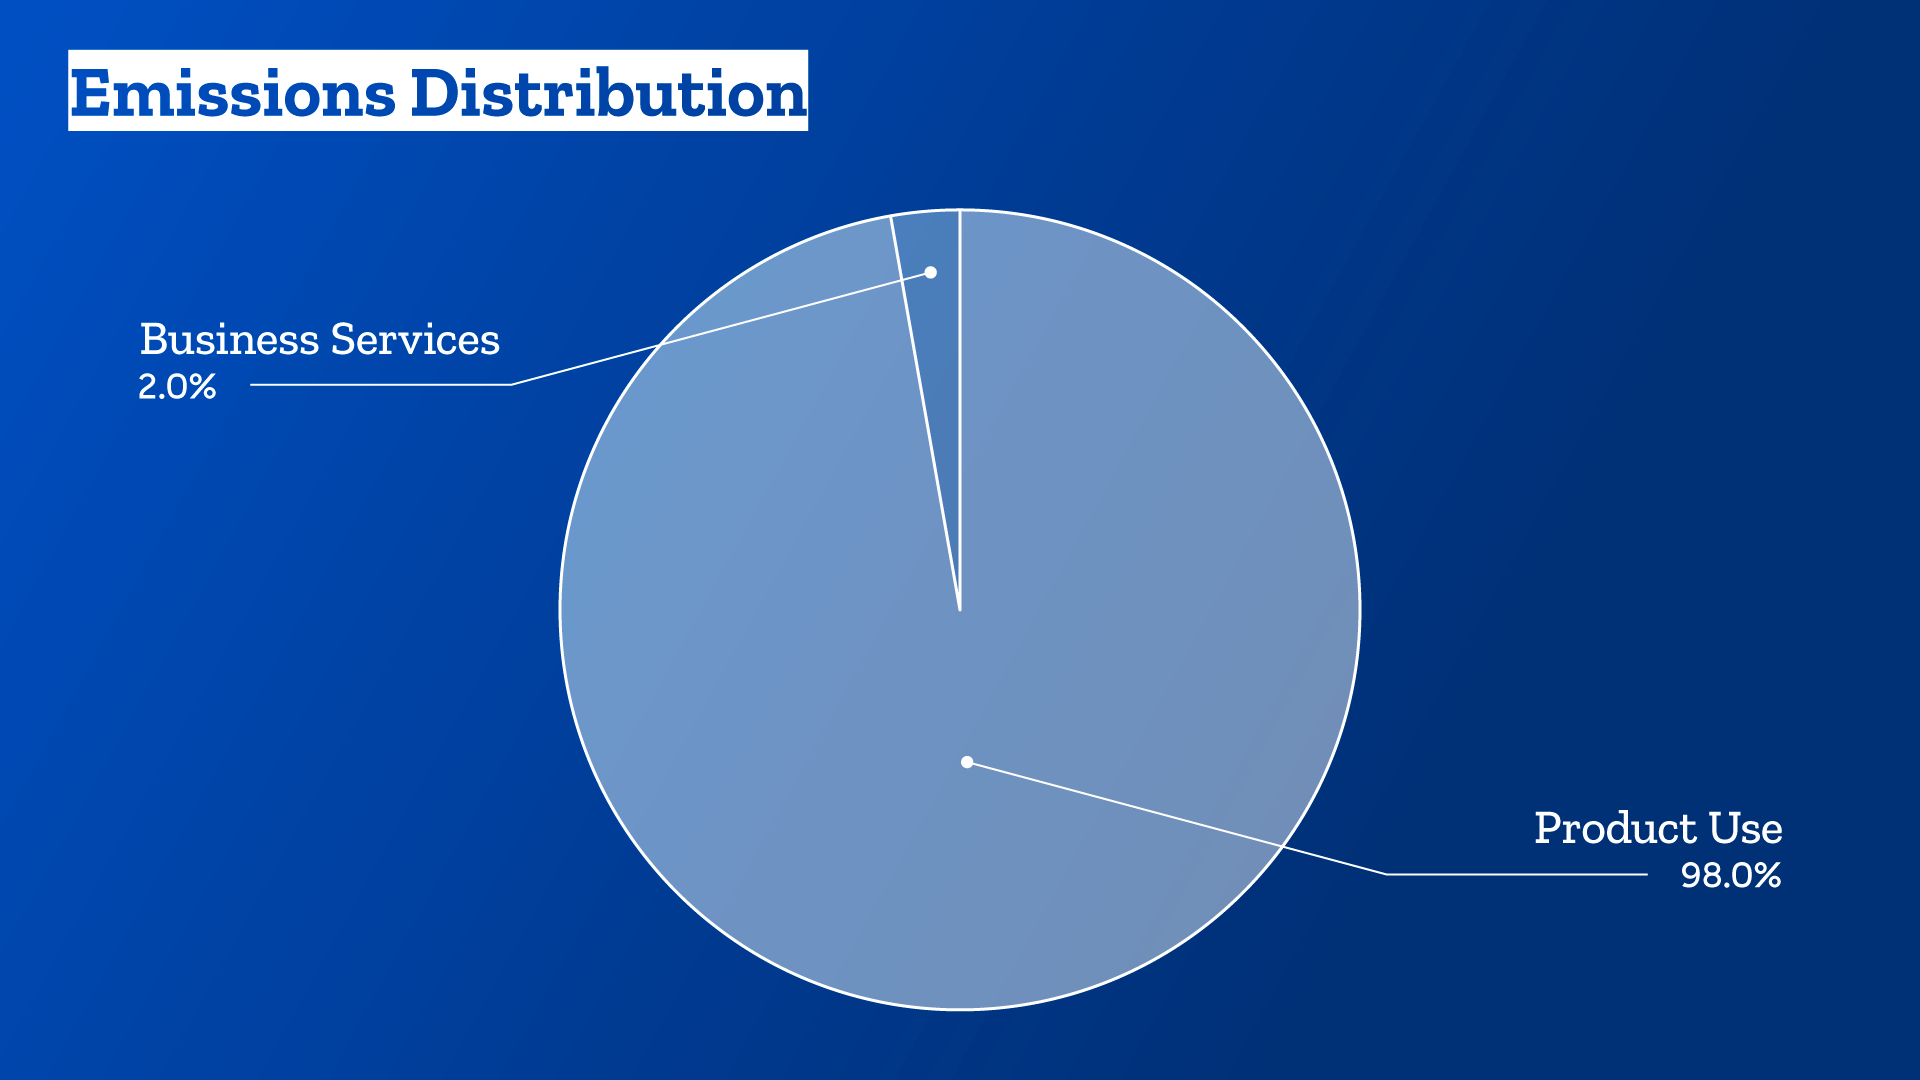
Quoting their work, emphasis mine:
Per the Greenhouse Gas Protocol, Mozilla is not required to calculate or report the product use emissions (scope 3, category 11) associated with using our products such as Firefox, Hubs and Pocket. However, Mozilla aims to lead by example and support transparency by reporting this optional data, and we began doing so in 2019. By taking this step, we hope to encourage our peers in the technology industry to do the same.
[…]
In 2022, the total emissions from using Mozilla’s products was 533,463 tons of carbon dioxide equivalent (tCO2e).
That’s 533,463 tons for use of Firefox and other projects, compared to 15,281 for all other aspects of Mozilla’s operations. 97% of the total emissions. Similar factors are at play with Wagtail, Django, and most likely lots of other open source projects.
Setting norms for the open source ecosystem
So we need to bring this type of thinking to more of the open source ecosystem, and the Python world in particular!
For Wagtail, I put together RFC 90: Sustainability roadmap, a roadmap for sustainability in Wagtail, supporting contributors and setting clear goals. This was with help from Lauri Apple, so the roadmap covers possible features / product enhancements but also clear ways to engage our community in those efforts. The changes we can do in this space are entirely dependent on adoption by users, so it’s crucial they understand what’s at stake and why to spend time on this. And formalizing our goals to reduce our footprint also helps us communicate how impactful we think any contributions in this space can be!
Bringing this to the wider Python world though, it takes time to find enough people working on this across projects to get together and move things along. I started on the Python forum in Who works on digital sustainability in the Python world?. Will keep things moving for Django and Python as much as possible.
Beyond measurements and reductions, a concrete step that projects can take is to create a sustainability statement, like Wagtail’s Sustainability page. This helps in communicating intensions, policies if any, and just results to date on how the project is working towards reducing its footprint.
Looking ahead
Finally, Chris and I touched on the importance of nurturing sustainability expertise within open-source communities and the broader technology industry. ClimateAction.tech is the best resource here in my experience, a community of technologists who consistently share their knowledge and experiences in digital sustainability.
And for Wagtail, the next step for us is to complete the grid-aware websites project put together by the Green Web Foundation! Hopefully we’ll be able to report back with quantified results in the next few months.