Wagtail’s approach to quantifying the carbon footprint of Wagtail websites, so we can reduce it.
As Wagtail took off as a project, it became crystal clear it would be popular. Not necessarily as popular as the most established CMS options (yet!), but still powering serious websites on the web. This popularity comes with a responsibility: for us to acknowledge Wagtail websites do have a clear carbon footprint in their operations. Those digital emissions contribute to the climate change impact of the digital world. This acknowledgement is the foundation of our commitment to sustainability.
Based on current research, emissions from Information and Communication Technologies represent on the order of 2 to 4% of global emissions (similar to major countries or transportation industries). And they’re projected significantly in the future. Let’s do our best to estimate Wagtail’s footprint within those numbers – so we can reduce it.
Our preferred methodology
Due to how carbon emissions originate at all points in the value chain of software, it can be very hard to estimate them accurately. We chose a methodology which makes up for its lack of precision by being very established and simple to apply: the Sustainable Web Design model. This is the model used by a lot of online calculators, such as Website Carbon.
This methodology clearly specifies two fundamentals decisions when estimating emissions:
- What to measure – often referred to as “system boundaries” or segments. This can be very complex on the web, where the fundamental website visitor experience involves a lot of infrastructure and devices, with different ownership structures.
- How to measure it – practically, how to compute emissions once the system boundaries are agreed.
System boundaries
Here are the system boundaries as defined by this methodology:
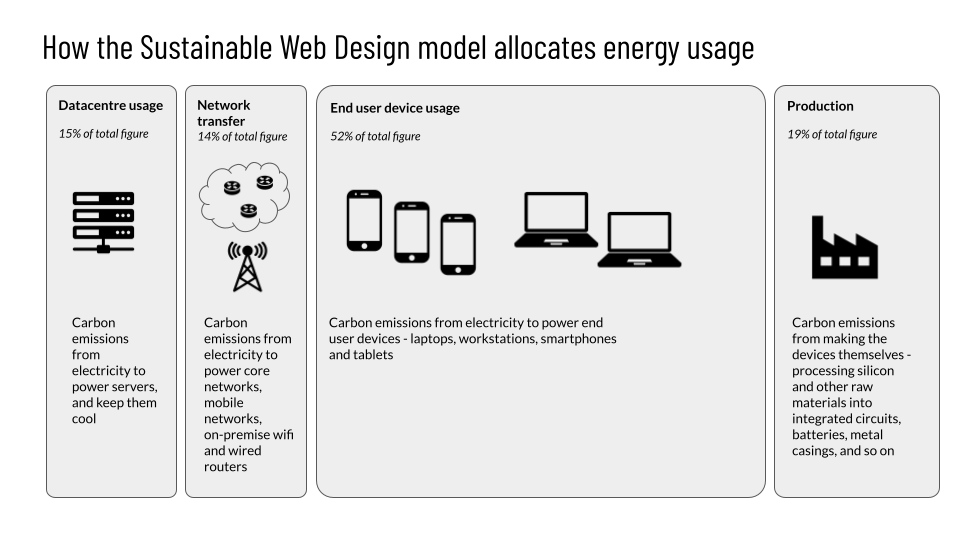
Image credit: Green Web Foundation, CO2.js
- Consumer device use: end users interacting with a product or service. This accounts for an estimated 52% of the system.
- Network use: data transferred across the network. This accounts for an estimated 14% of the system.
- Data center use: energy required to house and serve data. This accounts for an estimated 15% of the system.
- Hardware production: embodied energy used in the creation of embedded chips, use of data centers, use of networks, and the use of consumer communication devices. This accounts for an estimated 19% of the system.
Estimation approach
With system boundaries now defined, the model then defines how to measure energy usage (and therefore emissions) with one key metric: data transferred, in kWh/GB. The more data is stored, manipulated, transferred over the network, displayed on a page – the more emissions.
There are clear flaws with this approach: different types of data will be more or less taxing on different parts of the system. It’s nonetheless a good starting approximation because of how simple it is to measure the size of website pages.
More precise measurements
With the help of the Green Coding Berlin group and the Green Web Foundation, we’ve also been exploring much more precise measurements as part of the Green coding project. With their technology, we can measure detailed power consumption of specific components as a simulated user interacts with the site:
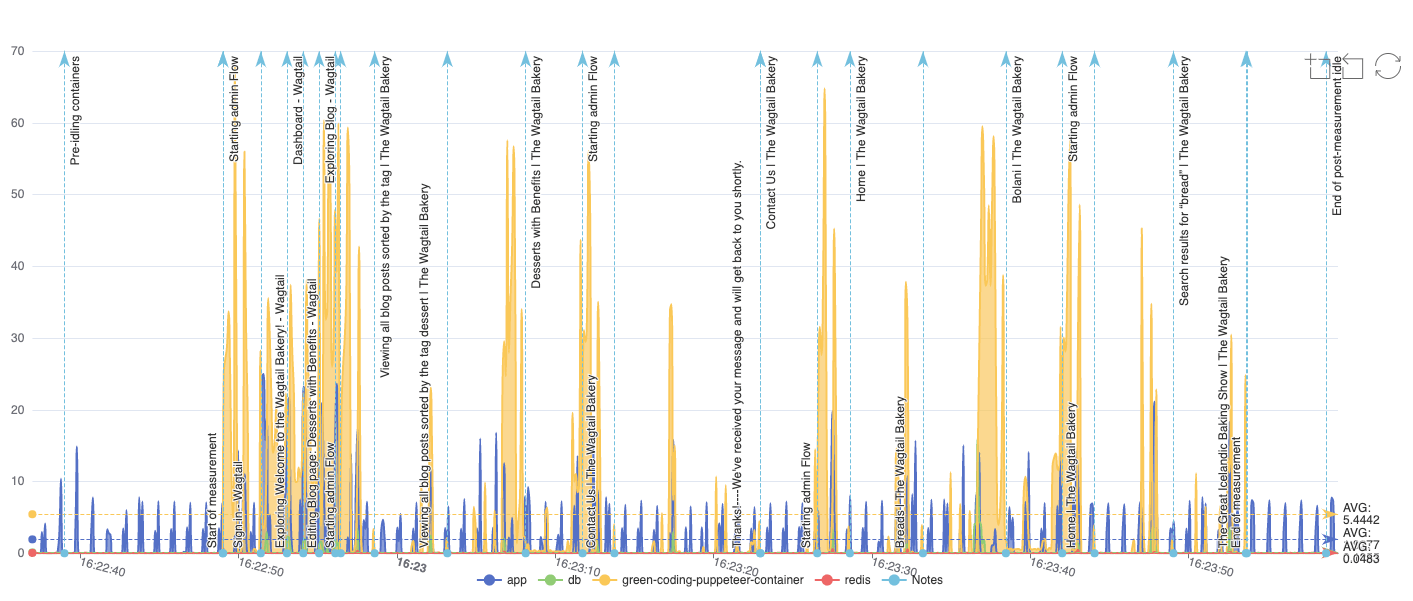
Here, we see how different parts of a website’s infrastructure consume more or less energy as part of specific aspects of serving pages.
Those measurements have the potential to allow us to quantify specific improvements to the CMS, therefore improving our ability to influence Wagtail websites’ footprint in the real world.
Measuring the Wagtail web
To apply our chosen methodology to Wagtail websites, out there, we can use publicly-available data: the Chrome UX Report (CrUX), HTTP Archive, and Wappalyzer. This is the same methodology as devised for the HTTP Archive’s yearly Web Almanac report, which had a Sustainability chapter for the first time in 2022.
With those datasets of websites’ homepages, as of April 2023, we get:
- 4349 websites reported as using Wagtail
- For those websites, a median page weight of 1.9 MB. This is higher than we’d like but in line with industry averages.
- Emissions per page visit on the order of 0.5 to 1.5 grams of CO2 equivalent per page view (gCO2e/pageview)
- Average emissions per site around 1.9 tCO2e/year
All in all – a total of 8240 tons of CO2e/year for all 4349 Wagtail sites. Though also in line with industry average carbon emissions data, this is an uncomfortable figure nonetheless. Which we now have to work to reduce.
Here is what those emissions look like as a tree map, with specific sites or countries sized according to their emissions:
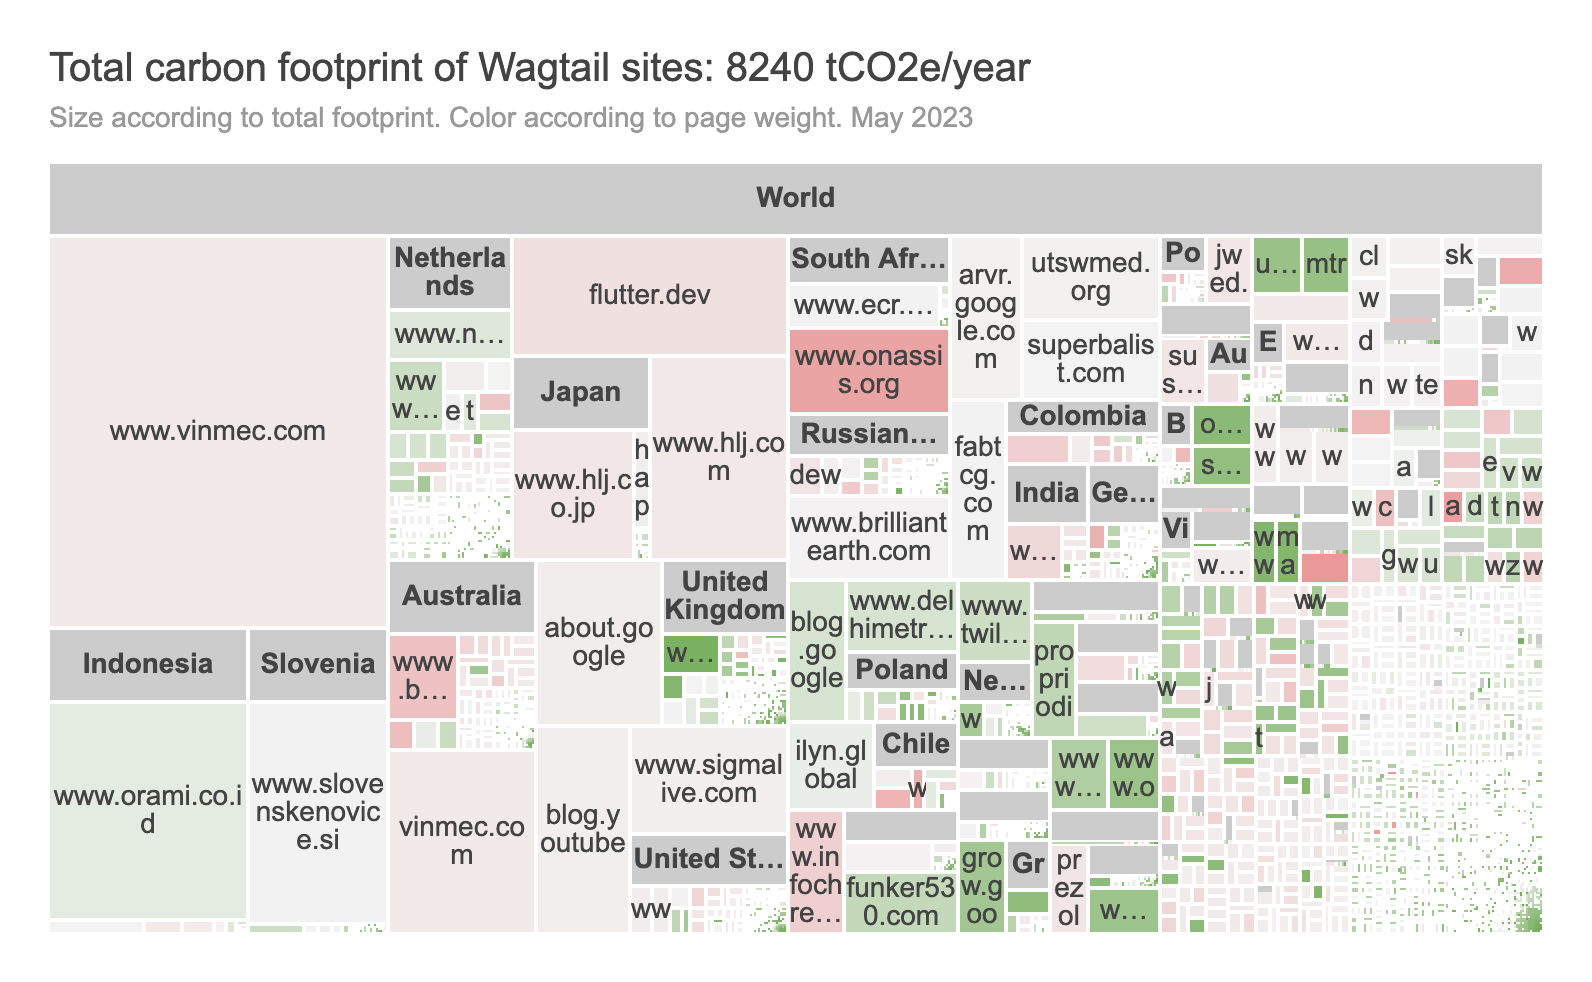
For further reference, access our full report and data: Wagtail sites emissions dashboard
What’s next
Based on this research, we’re hoping to inform future work. We’re soon starting Google Summer of Code internships with a green focus, and also hoping to place sustainability improvements on our roadmap with the view to secure sponsorships from organisations who want to reduce their carbon emissions.