Ever heard of Draft.js? We are rebuilding Wagtail’s rich text content management using this rich text editor framework from Facebook. Apart from a new editor, Draftail, we also needed an exporter to convert Draft.js content to HTML: the aptly-named draftjs_exporter.
In this post I’ll focus on this critical piece of the puzzle, which needs to operate as fast as possible regardless of how much content it has to handle. Memory profiling and benchmarks in a Python ecosystem were new to me, so here is what I learned along the way.
Why this was necessary
This may seem obvious but is worth stating: to improve performance, the first step is to measure it. It’s easy for developers to start optimising code based on instinct, but tooling is available to identify which parts are actually worth focusing on, which performance bottlenecks are the biggest. The general wisdom is to focus on hot paths (parts of the code executing often, eg. in loops), and apply the 80/20 rule: focusing optimisation efforts on some key parts of the code can reap much of the performance improvements. That said, measuring is the only way to know for sure how much of an improvement each potential change would make.
Measuring performance
To me, the golden standard for performance profiling is the Chrome DevTools. It profiles CPU, GPU, memory, network, frames rendering speed, and lots more, all out of the box without any change of the code. Here is a good illustration, profiling the load of Draftail’s demo:
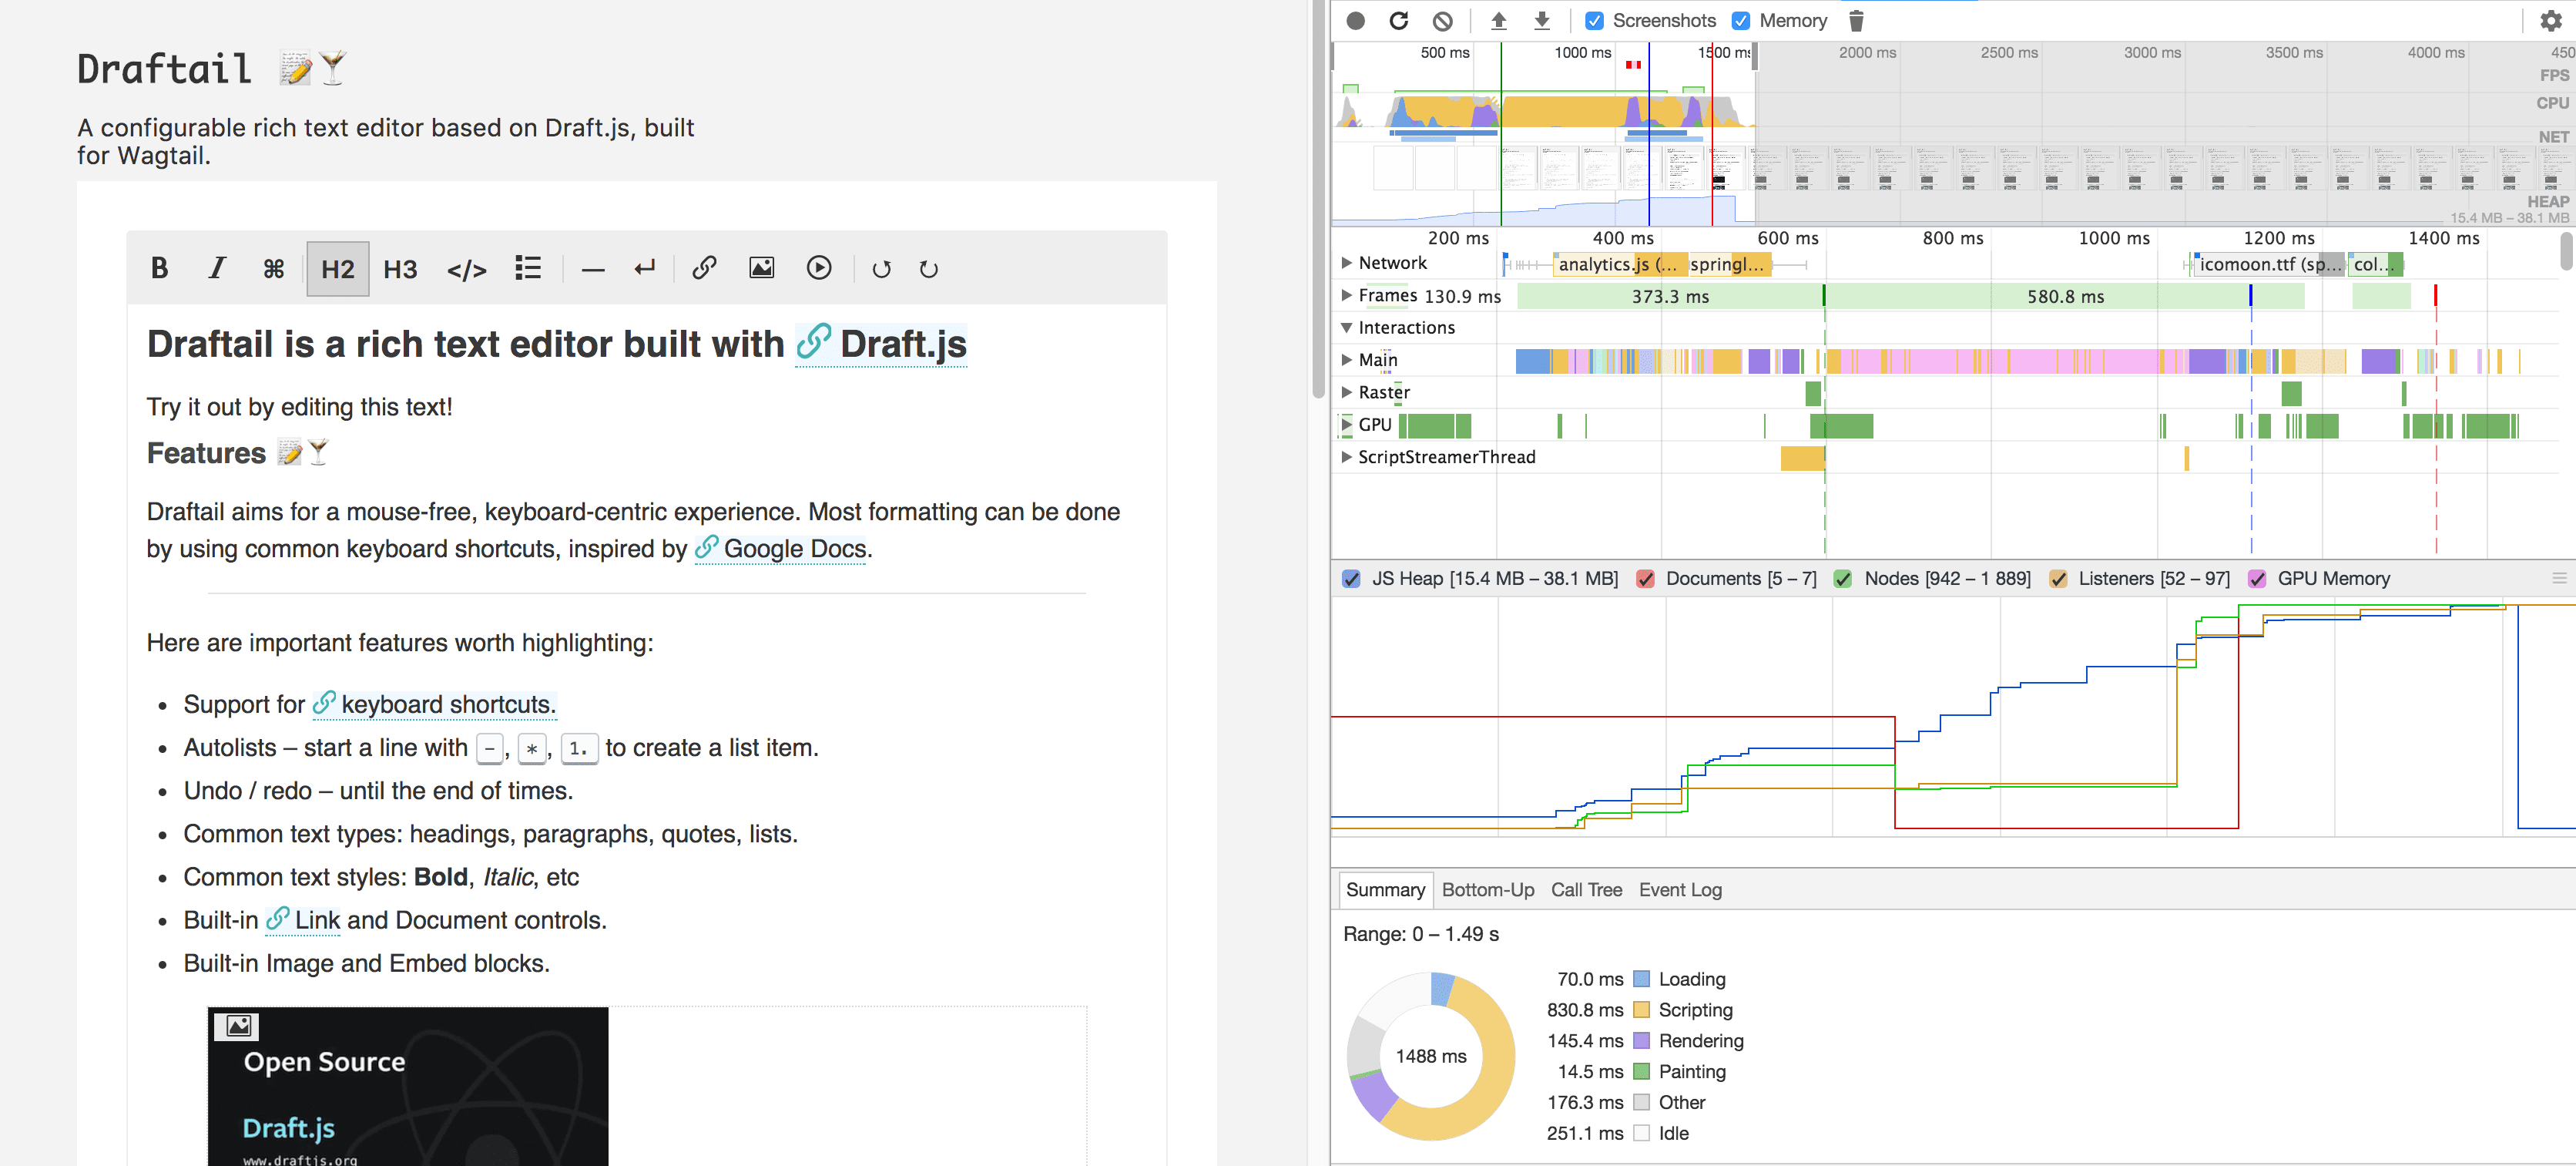
Can you spot for how long the toolbar looks broken because the icon font isn’t loaded yet?
Performance tooling in the Python ecosystem isn’t as simple to use. Lucky for us, the workload of the Draft.js exporter is much simpler: Draft.js content in, HTML out. We can focus on two metrics:
- Speed – how fast the exporter outputs HTML.
- Memory consumption – how much RAM the exporter uses while processing content.
Measuring speed in Python
There’s a built-in module for this! Yay! The cProfile module is part of the standard library, has little overhead, and provides insights into which parts of the code are slow with minimal work. Combined with pstats (built-in too!), its output looks like:
   820882 function calls (777342 primitive calls) in 0.563 seconds

   Ordered by: cumulative time
   List reduced from 82 to 10 due to restriction <10>

   ncalls  tottime  percall  cumtime  percall filename:lineno(function)
      792    0.013    0.000    0.563    0.001 html.py:30(render)
     5650    0.066    0.000    0.437    0.000 html.py:59(render_block)
     5650    0.018    0.000    0.129    0.000 wrapper_state.py:89(element_for)
     5650    0.040    0.000    0.100    0.000 html.py:85(build_command_groups)
      792    0.001    0.000    0.098    0.000 dom.py:138(render)
14924/792    0.017    0.000    0.098    0.000 string.py:78(render)
14914/792    0.011    0.000    0.097    0.000 string.py:74(render_children)
14914/792    0.018    0.000    0.095    0.000 string.py:76(<listcomp>)
18026/16862  0.047    0.000    0.091    0.000 dom.py:58(create_element)
    29668    0.014    0.000    0.049    0.000 dom.py:134(append_child)
From this, we learn that:
- The code took 563ms to run, with 820’882 function calls.
- Of this time and those function calls, the
render_block,element_for,build_command_groupswere all called 5’650 times. - Excluding the main API call
HTML.render(), therender_blockfunction is what took the longest to run, at 437ms. - The functions in
string.pyanddom.pyrun often, they should get special attention when optimising the code.
Here is minimal code that produces such a report. The actual output comes from benchmark.py in the Draft.js exporter repository.
import cProfile
from pstats import Stats


pr = cProfile.Profile()
pr.enable()

for i in range(0, 1000):
    print('Here, call the code you want to measure the performance of %s' % i)

pr.disable()
p = Stats(pr)

# This stats output is highlight configurable. Take the time to learn what options are available.
p.strip_dirs().sort_stats('cumulative').print_stats(10)
Profiling memory consumption
Did you see how simple it was to get a basic but effective speed measurement? No pip install, just a couple of imports, a few more lines and voilà! Too bad memory profiling isn’t as simple. I’m still learning how best to do this, here is what I found out so far.
The best package I found for this is memory_profiler. It provides line-by-line profiling of functions, which makes it invaluable to investigate specific parts of a program. Here is a sample output, again from benchmark.py:
    #L   Mem usage       Increment      Line Contents
    95  40.820312 MiB   0.000000 MiB   @profile(precision=6)
    96                                 def memory_consumption_run():
    97  40.820312 MiB   0.000000 MiB       exporter = HTML(config)
    98
    99  40.949219 MiB   0.128906 MiB       for content_state in content_states:
    100 40.949219 MiB   0.000000 MiB           exporter.render(content_state)
We learn that:
- The whole program takes up about 41 MiB (mebibytes, about 43MB).
- Initialising the exporter doesn’t consume much memory if any.
- Processing the export consumes ± 129KiB of memory in this example.
What’s cool about memory_profiler is that it also comes with a way to chart memory usage over time, using Matplotlib:
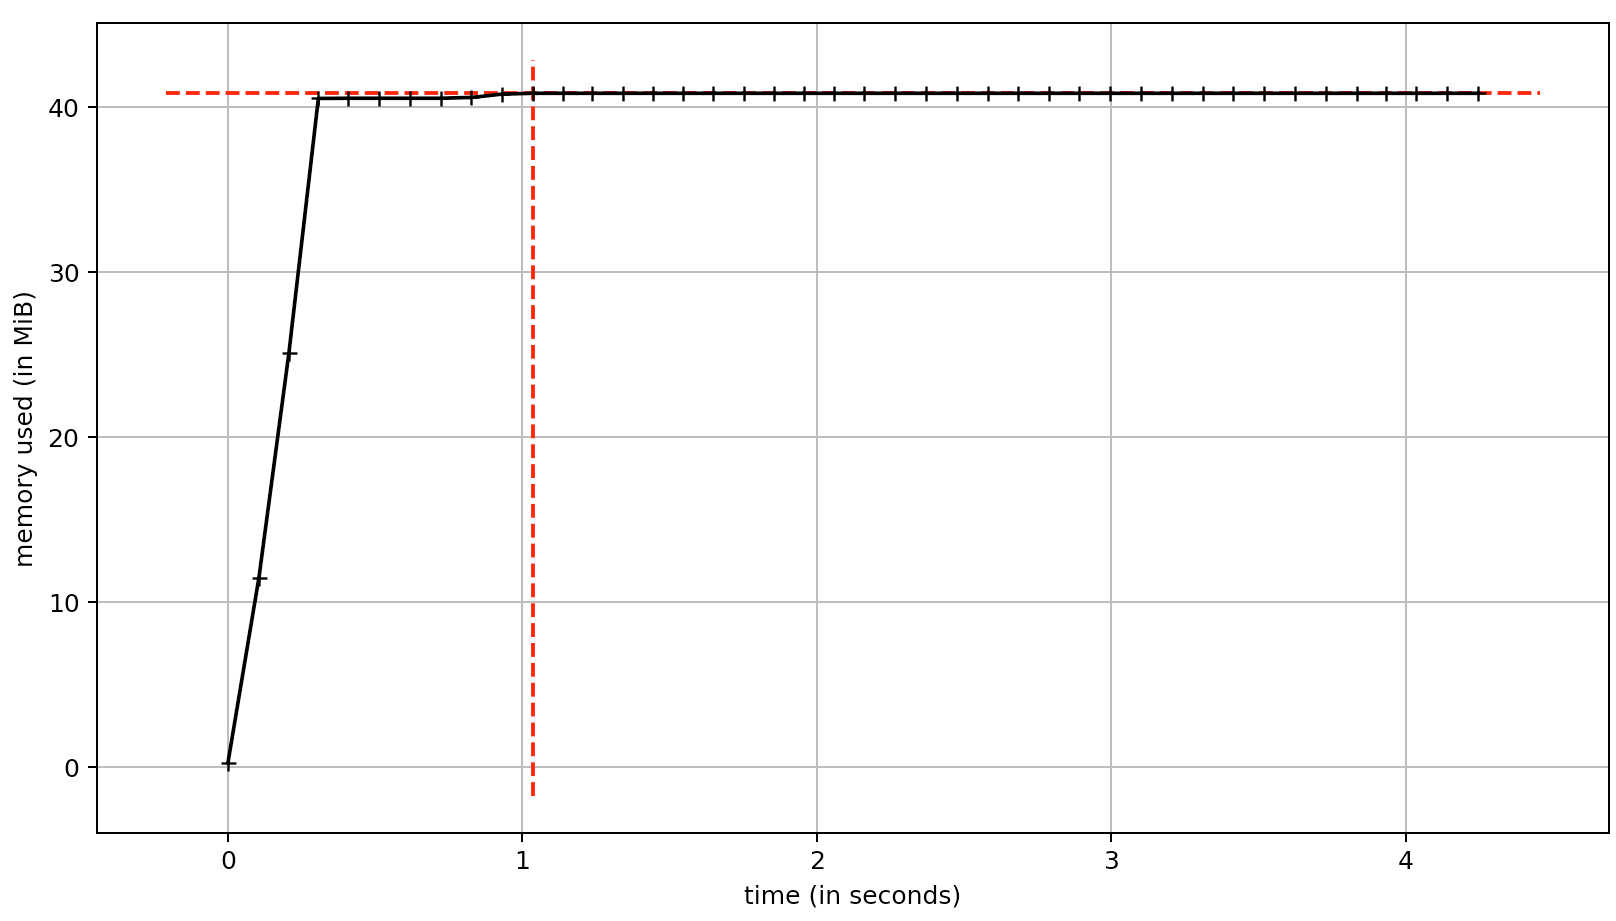
Here, we can see that after a sharp increase in memory usage, the memory consumption is mostly flat over the execution of the script. Unfortunately, using the profiler to understand where this memory consumption comes from takes quite a bit of manual work and fiddling with the code. The profiler is limited to line-by-line reporting for functions annotated with the @profile decorator or full-script over-time consumption, it has quite a big overhead which makes it impractical to run frequently (say on every code change), and most importantly there is no notion of “cumulative” memory consumption for a function. Calling a function 10 times will produce 10 separate reports.
Then again, getting that much information was easy:
from memory_profiler import profile

@profile(precision=6)
def memory_consumption_run():
    print('Easy!')

    for i in range(0, 1000):
        print('Here, call the code you want to measure the performance of %s' % i)

memory_consumption_run()
And to produce the chart:
mprof run benchmark.py
# NB: the plot command relies on Matplotlib. It may be a bit finicky to make this work on your system.
mprof plot
I’m still exploring how best to leverage memory_profiler. Its author has a great blog post that goes more in depth. For the exporter, I was able to identify that most of the memory consumption comes from loading the code, rather than its actual execution:
- ± 11.5 MiB are for the base Python process (ie. an empty script consumes that much)
- ± 15 MiB comes from the test content used in the script.
- ± 8 MiB comes from loading BeautifulSoup.
- That leaves us with ± 6.25 MiB for the exporter itself.
Using a good benchmark
All of those numbers are interesting on their own, but without any context it’s hard to judge of their significance. For a while, the exporter was profiled with a content load equivalent to a small blog post – A good indicator, but not the most representative of the types of site it’s meant for (large-scale, content-driven, hundreds of pages of rich text). To address this, I built markov_draftjs: a repository of sample content representative of a big website, with the content equivalent of about 200 pages of rich text. The actual content is computer-generated with Markov chains of Project Gutenberg books, while the specific rich text features in use (and their frequency in the content) match the load of a real CMS-driven site.
The takeaway is: without a good benchmark, it will be harder to judge whether given optimisations actually make a difference in real-world performance!
Optimising the exporter
Coming back to the purpose of this work, we wanted to make the exporter faster. @su27, an early adopter, started this conversation with performance feedback and profiling help.
This quickly led to a 20-30x (!) speedup, from 500 to 10ms for the sample “blog post size”. This one improvement came from a single line of code, perfectly illustrating the importance of the 80/20 rule. With these “low-hanging fruit” optimisations out of the way, the biggest performance bottleneck was the HTML generation, which led us to change the exporter API to allow custom HTML-generating engines to facilitate iterations on this code. If you want to learn more than necessary about lxml vs html5lib vs (or with!) BeautifulSoup, the Draft.js repository and its issues contain plenty of notes.
With the performance tooling in place, we were then able to check that new features added to the exporter would not degrade its performance, and to make incremental improvements by changing its content parsing logic. We made good progress from version to version, all the while adding more functionality:
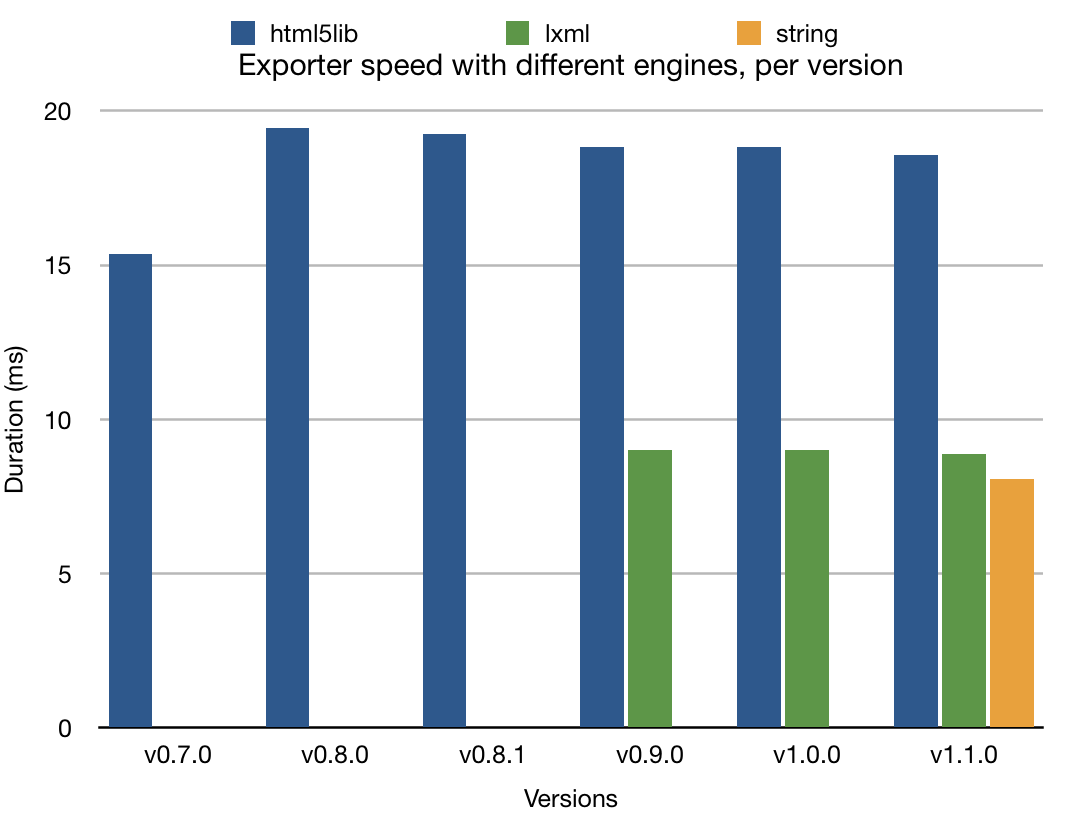
Exporter speed per version, for each HTML generation engine.
View chart data
```text version,html5lib,lxml,string v0.7.0,15.37, v0.8.0,19.44, v0.8.1,19.26, v0.9.0,18.84,8.99 v1.0.0,18.84,8.99 v1.1.0,18.57,8.87,8.08 ```The rightmost line is the latest progress: a new dependency-free engine, thanks to the feedback of @BertrandBordage, who knows a great deal about Python performance and optimisations (he made Django Cachalot, a popular ORM caching tool for Django!).
With the engine API, and the benchmark content work done previously, we were able to meaningfully compare the impact of various optimisations, and of the different engines:
html5lib         lxml              string
Min.   :1.271    Min.   :0.6150    Min.   :0.5190
1st Qu.:1.333    1st Qu.:0.6300    1st Qu.:0.5310
Median :1.347    Median :0.6350    Median :0.5360
Mean   :1.351    Mean   :0.6366    Mean   :0.5384
3rd Qu.:1.361    3rd Qu.:0.6410    3rd Qu.:0.5410
Max.   :1.756    Max.   :0.7960    Max.   :1.0250
All in all, we went from 5 seconds to render the equivalent of one small blog post, to 500ms for 792 content chunks representative of one whole website!
Next steps
With the HTML generation now operating only on strings without any further dependencies, it feels like the next speedups will be much harder to reach. Here are some areas to explore:
- Writing the same “string” engine in C? The engine is only 100 lines of code, most of which run on the hot paths of the exporter’s rendering code.
- Refactoring the content parsing algorithm to reduce algorithmic complexity. Surely this could be at least
O(N)on the number of blocks, if it’s not already. - Further optimising for real-world workloads. Because test content isn’t always representative of real-world usage.
- Streaming rendering? I have no idea how hard this would be to do in Python / Django, but this would definitely speed-up the rendering of long content chunks in the context of a website.
Takeaways
Starting this process, I would have never thought that the biggest speedups would come from fixing programming mistakes. Having the tooling in place quickly made these obvious, and came with the biggest speedups (20-30x). Hunting for further improvements forced us to rethink the API of the exporter, and led us to simplifying it greatly to match that of React. Finally, we had to consider real-world content workloads over experimental ones to find further speedups. In the end, it’s not just the exporter’s performance that has improved but its overall quality and usefulness as a general-purpose library.
For Wagtail, introducing components that are performance-tested (and heavily unit-tested, more on that in another post) increases the confidence that the changes will not have adverse effects for end users, and generally raises the bar for software quality. Now onto Draftail performance testing!
Special thanks to @su27, Loic Teixeira, and Bertrand Bordage for their help building the exporter. Thanks to Springload for supporting building this open-source project in the first place 💚.